


_22.jpg)
Key Takeaways
Vacancy rate, turnover time, and maintenance cost ratio are the three core rental KPIs that predict cash flow and long-term returns for Dallas investors.
Days on market and rent growth track your competitive position in the DFW market, where pricing 10% above market can push vacancy to 66 days or longer.
Cap rate and cash-on-cash return tie your KPI data to actual wealth building and help you compare this investment against others in your portfolio.
A property manager who tracks and reports these numbers monthly gives you the data to spot problems early and adjust strategy before vacancy compounds losses.
For Dallas and North Texas rental owners, tracking the right key performance indicators reveals whether a property is performing at market, underperforming, or generating excess returns.
The most common mistake investors make is watching rent alone while ignoring vacancy, turnover costs, and days on market.
This guide, by SGI Property Management Dallas walks you through the rental KPIs that matter most, how to calculate them, what Dallas market benchmarks look like in 2026, and how to use them to make faster, better decisions about your property.
Want More Information?
The Core Three: Vacancy, Turnover, and Maintenance
Vacancy rate is how often your unit is unoccupied. It’s calculated by dividing the number of vacant days by the total number of days in the period, then multiplying by 100.
Tracking vacancy month by month tells you whether your property manager is pricing competitively and leasing fast or whether you're bleeding rent into a slow market.
Turnover cost is the total expense to replace a resident: leasing commission, marketing, move-out inspection, repairs, cleaning, and lost rent during vacancy.
Tracking turnover cost per lease cycle tells you whether your property manager is retaining quality residents or churning through tenants at high cost.
A 14-day leasing guarantee, like SGI Property Management Dallas offers, reduces the risk that a home sits unrented while the manager fumbles placement.
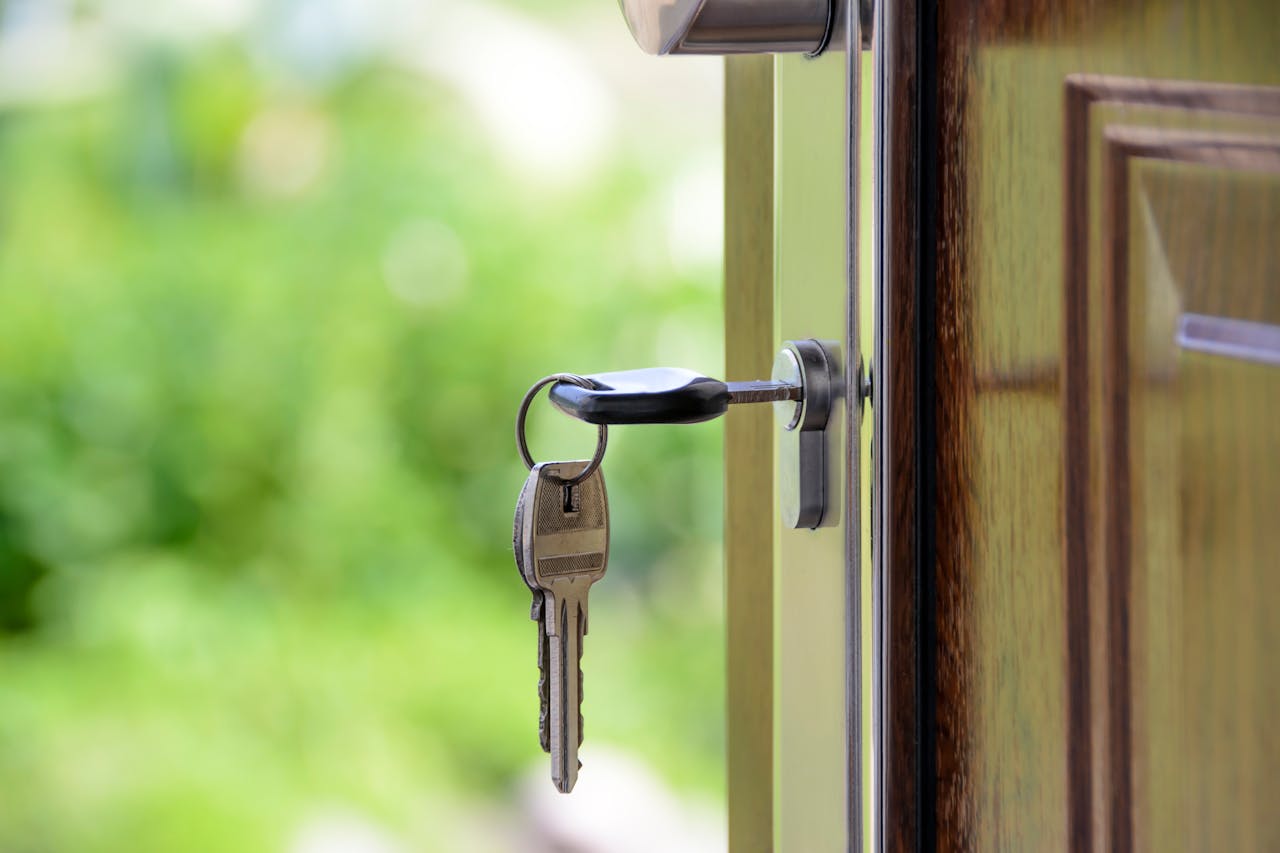
Turnover time, sometimes called turn time, is the calendar days between move-out and move-in. Industry best practice is 7 to 14 days. Anything longer than 21 days signals either deferred maintenance, poor contractor coordination, or slow leasing.
Days on Market and Rent Growth
Days on market (DOM) is the number of days between listing and lease execution. It's different from vacancy time and tells you how quickly your property manager can convert a vacant unit into a signed lease. The DFW average is about 27 days.
Rent growth is the annual percentage increase in rent at lease renewal or new lease. Texas has no rent control, so rent growth is a pure market and positioning play.
Tracking rent growth quarter by quarter and year over year shows whether your property is keeping pace with neighborhood appreciation or lagging.
A property manager who negotiates renewals and manages lease timing can push rent growth; one who doesn't leaves money on the table.
Want to Know More About Your Property?
Maintenance Cost Ratio and Capital Preservation
Maintenance cost ratio is annual maintenance and repair spend divided by annual rent, expressed as a percentage.
Dallas and North Texas weather drives distinct maintenance patterns. Spring brings hail season and roof inspections. Summer requires HVAC load testing and service before peak cooling demand. Winter demands freeze protection and pipe risk assessment.

A property manager with a vetted, negotiated vendor network and 24/7 maintenance response can catch problems early and prevent expensive emergency repairs.
Cap Rate and Cash-on-Cash Return
Cap rate is net operating income (NOI) divided by property purchase price. It's a snapshot of annual return on your invested capital, before debt service.
Cash-on-cash return is annual cash flow divided by cash invested, and it includes financing. Both tie your KPI data to actual wealth building.
Many investors focus on rent growth and miss cap rate entirely. A property that appreciates 5% per year but runs a 3% cap rate is relying on price appreciation, not cash flow.
In a down market like Dallas 2026, appreciation may not materialize. Tracking cap rate and cash-on-cash return forces you to ask whether the property is actually working today, not just betting on tomorrow.
Want to Know More About Us?
Setting Benchmarks and Spotting Drift
Benchmark your property against market averages, not against your hopes. DFW average DOM is 27 days; if yours is 45, you have a problem.
The City of Dallas Single-Family Rental Registration and Inspection Program requires annual registration and a self-inspection checklist, and the city inspects at least once every five years. That's a maintenance and compliance cost many investors underestimate.

A property manager who delivers monthly statements, work orders, and an owner portal gives you the raw data to calculate these KPIs yourself.
SGI Property Management Dallas provides monthly reports and an owner portal so you can track occupancy, maintenance spend, and rent collection in real time. Spotting a 15-day delay in rent collection or a spike in maintenance cost in month two, not month six, lets you act early.
Bottom Line
Rental KPIs are not abstract metrics. Vacancy rate tells you whether your property is leasing fast enough. Turnover cost tells you whether your manager is retaining residents or burning cash. Days on market tells you whether you're competitive.
The maintenance cost ratio tells you whether the property is in decline. Cap rate and cash-on-cash return tie all of that to actual money in your pocket.
SGI Property Management Dallas provides monthly reporting and owner portal access so you can pull these numbers yourself and hold the property accountable to performance.
Ready to Get Started?
Frequently Asked Questions
What is a Good Vacancy Rate for Rental Properties in Dallas?
A healthy vacancy rate for single-family rentals in Dallas is 5% to 8% annually. That translates to 18 to 29 days vacant per year, accounting for turnover, marketing, and the normal gap between move-out and move-in.
National SFR vacancy sat around 6.1% in Q1 2026. In Dallas's softening 2026 market, vacancy rates have crept higher as renters have more options and landlords offer concessions.
How Do I Calculate Turnover Costs for My Dallas Rental?
Turnover cost includes leasing commission (typically 50% to 100% of one month's rent), marketing and advertising, move-out inspection and cleaning, repairs and painting, and lost rent during vacancy.
Add these up for each turnover. If your rent is $2,000, turnover commission is $1,000 to $2,000, cleaning is $300 to $500, repairs are $200 to $1,000, and vacancy is 30 days ($2,000), your total turnover cost is $3,500 to $5,500.
If turnover costs $4,000 and renewal costs nothing, renew. If turnover costs $4,000 and you can grow rent 5% ($100 per month), turnover pays for itself in 40 months of higher rent.
What is the Difference Between Days on Market and Vacancy Time?
Days on market (DOM) is the calendar days from listing to lease execution. Vacancy time is the total days the unit sits unrented, including marketing, leasing, and any turnover work.
A home might list on day one, lease on day 27 (27 DOM), but the resident doesn't move in until day 35 due to a five-day inspection and repair window. Vacancy time is 35 days; DOM is 27 days.
How Much Should I Spend on Maintenance and Repairs as a Percentage of Rent?
A healthy maintenance cost ratio for single-family rentals is 8% to 12% of annual rent. A $2,000 monthly rent should run $160 to $240 in annual maintenance and repairs. Anything above 15% signals deferred maintenance, poor contractor pricing, or a property in decline.
Track maintenance by category (HVAC, plumbing, roof, appliances, general) to spot patterns. If HVAC costs spike every summer, the unit needs replacement. If plumbing runs high, you have a systemic issue.
Why Should I Track Cap Rate and Cash-on-Cash Return if I'm Already Tracking Rent and Vacancy?
Cap rate and cash-on-cash return tie your operational KPIs to actual wealth building. A property with low vacancy and strong rent can still run a 3% cap rate if maintenance is high or management fees are excessive.
Cash-on-cash return includes financing and shows whether your down payment is generating a competitive return. A Dallas single-family home purchased at $378,000 with $2,000 rent and 8% vacancy might run a 4.3% cap rate but only a 4.1% cash-on-cash return after debt service.
Let's Get Started!